Quarterly Considerations - Second Quarter 2021
By Crescent Team
MARKET EVENTS

Source: FactSet as of 6/30/21. Global Equity represented by MSCI ACWI Gross Total Return USD Index. See disclosures for list of indices representing each asset class. Past performance does not indicate future performance and there is a possibility of a loss.
MARKET THEMES
Stimulus measures and vaccination efforts have fostered historically robust GDP growth.
Inflation, while elevated, should not ultimately threaten the global recovery.
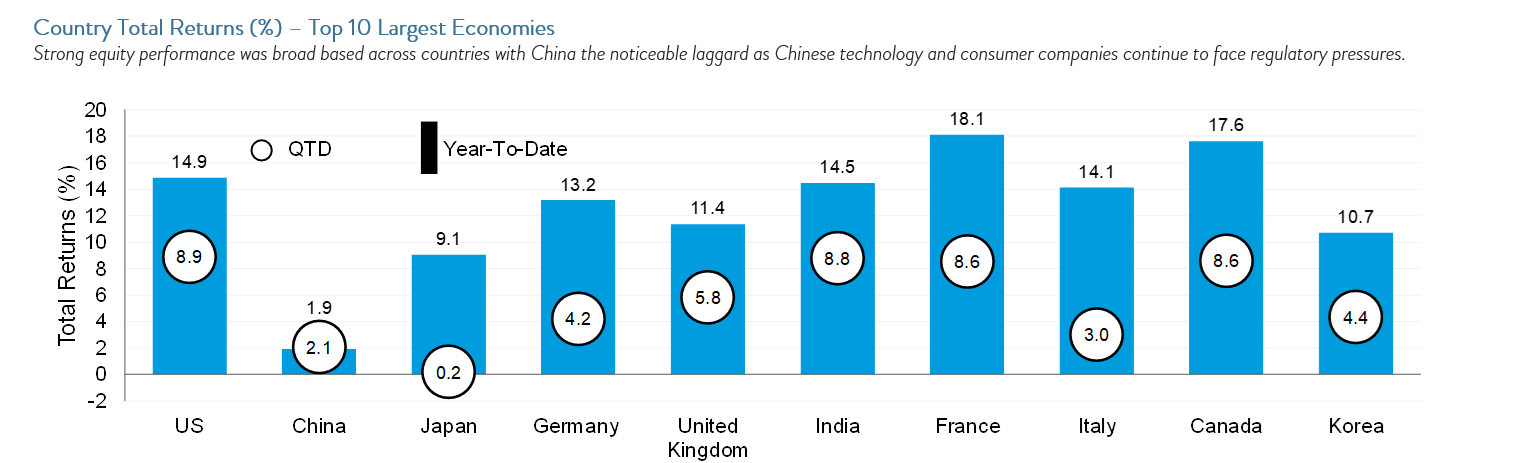
The breadth of asset class returns ratifies the pace of economic momentum with the highest returns year-to-date sourced from areas of the markets closely aligned with reopening.

Source: FactSet

Source: FactSet, U.S. Bureau of Labor Statistics, Federal Reserve. See disclosures for list of indices representing each asset class. Past performance does not indicate future performance and there is a possibility of a loss.

See disclosures for list of indices representing each asset class. Past performance does not indicate future performance and there is a possibility of a loss.
ECONOMIC REVIEW


Source: FactSet. See disclosures for list of indices representing each asset class. Past performance does not indicate future performance and there is a possibility of a loss.
FIXED INCOME MARKET UPDATE


Sources: FactSet. Past performance does not indicate future performance and there is a possibility of a loss.
EQUITY MARKET UPDATE

Sources: Fact Set, Russell 1000
Source: FactSet. Past performance does not indicate future performance and there is a possibility of a loss.
REAL ASSET MARKET UPDATE

Source: FactSet. Past performance does not indicate future performance and there is a possibility of a loss.
THE CASE FOR DIVERSIFICATION

See disclosures for list of indices representing each asset class. Past performance does not indicate future performance and there is a possibility of a loss.
FINANCIALS MARKETS PERFORMANCE

*One month lag.
Source: FactSet & Morningstar as of 6/30/21. Periods greater than 1 year are annualized. All returns are in U.S. dollar terms.
Download a PDF of this blog.
DISCLOSURES AND DEFINITIONS
All material and information is intended for Crescent Wealth Advisory business only. Any use or public dissemination outside firm business is prohibited. Information is obtained from a variety of sources which are believed though not guaranteed to be accurate. Any forecast represents future expectations and actual returns, volatilities and correlations will differ from forecasts. Past performance does not indicate future performance. This presentation does not represent a specific investment recommendation. Please consult with your advisor, attorney and accountant, as appropriate, regarding specific advice.
When referencing asset class returns or statistics, the following indices are used to represent those asset classes, unless otherwise notes. Each index is unmanaged, and investors can not actually invest directly into an index:
TIPS: Bloomberg Barclays Global Inflation-Linked: U.S. TIPS Total Return Index Unhedged
Municipals 5-Year: Bloomberg Barclays Municipal Bond 5 Year (4-6) Total Return Index Unhedged USD
Core Bond: Bloomberg Barclays US Agg Total Return Value Unhedged USD
High Yield Municipals: Bloomberg Barclays Muni High Yield Total Return Index Value Unhedged USD
High Yield: Bloomberg Barclays US Corporate High Yield Total Return Index Value Unhedged USD
Foreign Bond: Bloomberg Barclays Global Aggregate ex-USD Total Return Index Value USD (50/50 blend of hedged and unhedged)
EM Debt (unhedged): J.P. Morgan GBI-EM Global Diversified Composite Unhedged USD
U.S. Large Cap: S&P 500 Total Return Index
U.S. Small Cap : Russell 2000 Total Return Index
International Developed: MSCI EAFE Net Total Return USD Index
Emerging Markets: MSCI Emerging Markets Net Total Return USD Index
World: MSCI ACWI Net Total Return USD Index
U.S. Equity REITs: FTSE Nareit Equity REITs Total Return Index USD
Commodities: Bloomberg Commodity Total Return Index
Midstream Energy: Alerian MLP Total Return Index
Hedge Funds: Hedge Fund Research HFRI Fund of Funds Composite Index
Event Driven: Hedge Fund Research HFRI Event-Driven Total Index
Relative Value: Hedge Fund Research HFRI Relative Value Fixed Income-Convertible Arbitrage Index
Equity Hedge: Hedge Fund Research HFRI Equity Hedge Total Index
Direct Fund Composite: Hedge Fund Research HFRI Fund Weighted Composite Index
Fund of Funds Composite: Hedge Fund Research HFRI Fund of Funds Composite Index
Macro: Hedge Fund Research HFRI Macro Total Index
International, 7% Emerging Markets, 5% U.S. Equity REITS, 6% MLPs
U.S.: MSCI USA Net Total Return USD Index
China: MSCI CHINA Net Total Return USD Index
Japan: MSCI Japan Net Total Return USD Index
Germany: MSCI Germany Net Total Return USD Index
India: MSCI India Net Total Return USD Index
United Kingdom: MSCI UK Net Total Return USD Index
France: MSCI France Net Total Return USD Index
Italy: MSCI Italy Net Total Return USD Index
Brazil: MSCI Brazil Net Total Return USD Index
Canada: MSCI Canada Net Total Return USD Index