Quarterly Considerations - Third Quarter 2020
By Crescent Team
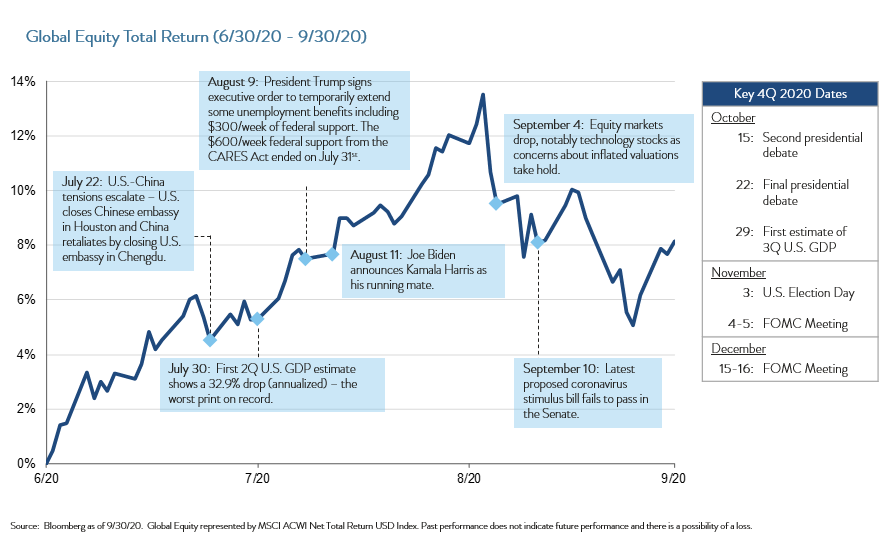
3Q 2020 MARKET EVENTS
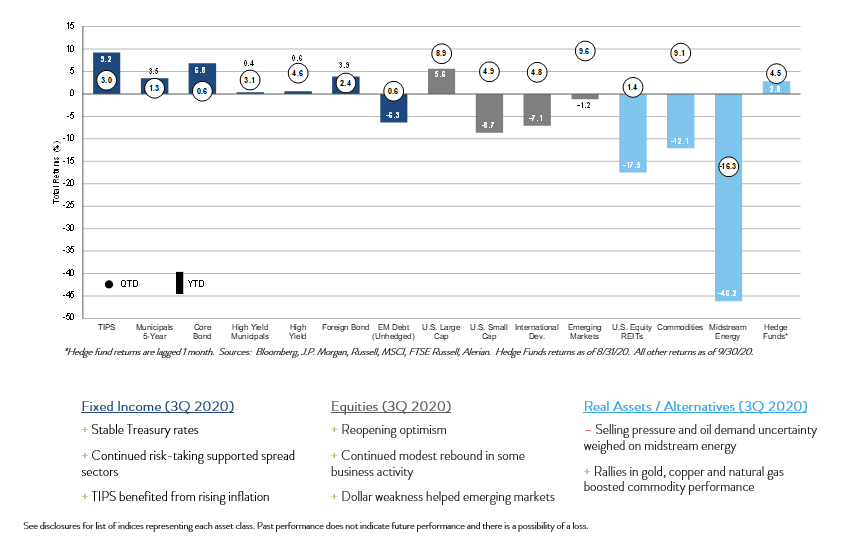
ASSET CLASS PERFORMANCE
MARKET THEMES

MARKET THEMES
MARKET THEMES - U.S. ELECTION

FIXED INCOME MARKET UPDATE

EQUITY MARKET UPDATE

ALTERNATIVES MARKET UPDATE

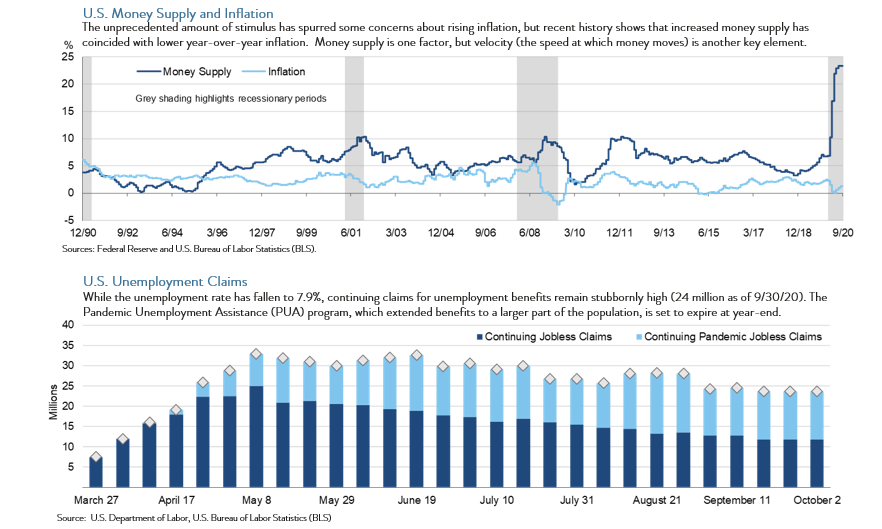
ECONOMIC REVIEW

THE CASE FOR DIVERSIFICATION

FINANCIAL MARKETS PERFORMANCE

Download a PDF version of this blog.
DISCLOSURES
All material and information is intended for DiMeo Schneider & Associates, L.L.C. business only. Any use or public dissemination outside firm business is prohibited. Information is obtained from a variety of sources which are believed though not guaranteed to be accurate. Any forecast represents future expectations and actual returns, volatilities and correlations will differ from forecasts. Past performance does not indicate future performance. This presentation does not represent a specific investment recommendation. Please consult with your advisor, attorney and accountant, as appropriate, regarding specific advice.
When referencing asset class returns or statistics, the following indices are used to represent those asset classes, unless otherwise notes. Each index is unmanaged and investors can not actually invest directly into an index:
TIPS: Bloomberg Barclays Global Inflation-Linked: U.S. TIPS Total Return Index Unhedged
Municipals 5-Year: Bloomberg Barclays Municipal Bond 5 Year (4-6) Total Return Index Unhedged USD
Core Bond: Bloomberg Barclays US Agg Total Return Value Unhedged USD
High Yield Municipals: Bloomberg Barclays Muni High Yield Total Return Index Value Unhedged USD
High Yield: Bloomberg Barclays US Corporate High Yield Total Return Index Value Unhedged USD
Foreign Bond: Bloomberg Barclays Global Aggregate ex-USD Total Return Index Value USD (50/50 blend of hedged and unhedged)
EM Debt (unhedged): J.P. Morgan GBI-EM Global Diversified Composite Unhedged USD
U.S. Large Cap: S&P 500 Total Return Index
U.S. Small Cap : Russell 2000 Total Return Index
International Developed: MSCI EAFE Net Total Return USD Index
Emerging Markets: MSCI Emerging Markets Net Total Return USD Index
World: MSCI ACWI Net Total Return USD Index
U.S. Equity REITs: FTSE Nareit Equity REITs Total Return Index USD
Commodities: Bloomberg Commodity Total Return Index
Midstream Energy: Alerian MLP Total Return Index
Hedge Funds: Hedge Fund Research HFRI Fund of Funds Composite Index
Event Driven: Hedge Fund Research HFRI Event-Driven Total Index
Relative Value: Hedge Fund Research HFRI Relative Value Fixed Income-Convertible Arbitrage Index
Equity Hedge: Hedge Fund Research HFRI Equity Hedge Total Index
Direct Fund Composite: Hedge Fund Research HFRI Fund Weighted Composite Index
Fund of Funds Composite: Hedge Fund Research HFRI Fund of Funds Composite Index
Macro: Hedge Fund Research HFRI Macro Total Index
Balanced*: 2% 3-month Treasury bill, 2% TIPS, 32% Core Bond, 4% High Yield , 3% Foreign Bond. 2% EM Debt (unhedged), 17% U.S. Large Cap, 5% U.S. Small Cap, 15% International, 7% Emerging Markets, 5% U.S. Equity REITS, 6% MLPs
U.S.: MSCI USA Net Total Return USD Index
China: MSCI CHINA Net Total Return USD Index
Japan: MSCI Japan Net Total Return USD Index
Germany: MSCI Germany Net Total Return USD Index
India: MSCI India Net Total Return USD Index
United Kingdom: MSCI UK Net Total Return USD Index
France: MSCI France Net Total Return USD Index
Italy: MSCI Italy Net Total Return USD Index
Brazil: MSCI Brazil Net Total Return USD Index
Canada: MSCI Canada Net Total Return USD Index